This command can be used to topology elements (nodes, sections) with different colors according to specific condition.
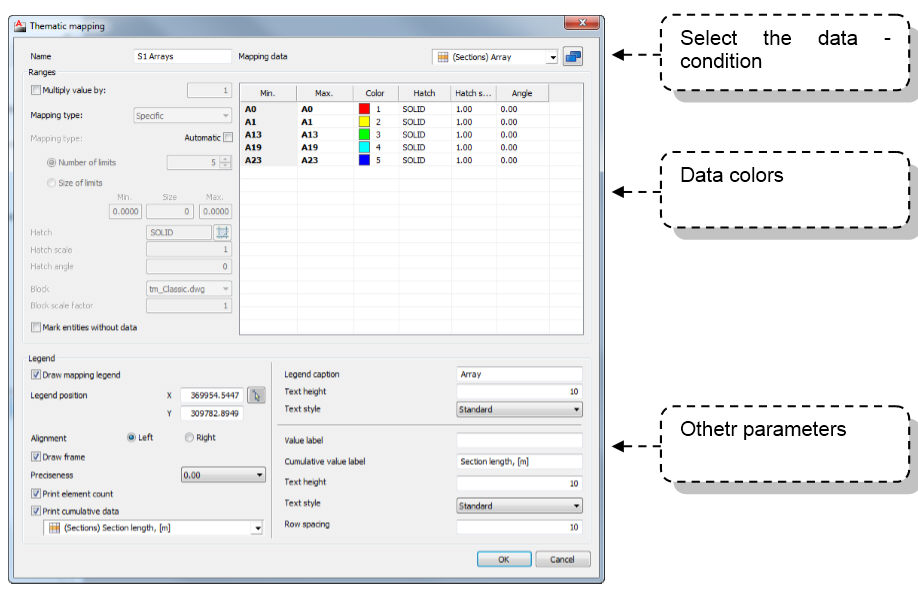
To create new thematic map configuration, click on Theme mappings – Sections/Nodes – New.
Select the data that will represent the condition from the upper right part of the dialog:

Thematic mapping of sections changes the color of line that represents section.
Thematic mapping of nodes draws circle around node in appropriate color.
Thematic mapping of polygons shows a colored hatch over each polygon.
Thematic mapping can created in two ways if selected condition (data) is number (e.g. terrain height).
Selecting option "Specific", each specific value will be colored with one color (e.g. one pipe diameter – one color).
With option "Continuous", it is necessary to define number of limits by which mapping will be done or size of limits.
They have to be typed in appropriate fields. Beside field "Size" there is data about minimum and maximum value of selected key.
Colors that represent each value of the key can be set in two ways.
By selecting option "Automatic" program will automatically define certain color for each value of the data. User can define number of colors that will be used for thematic mapping. When this option is turned off user can define specific color for each value of the key. Colors can be changed in drop down list by selecting appropriate color. Drop down list is opened when user selects color for certain condition in the table.
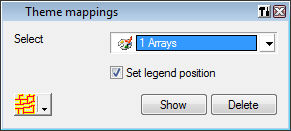
To map the elements, double-click on the configuration, following dialog will appear:

If you turn on option Set legend position, pick somewhere in the drawing and the legend table will be drawn.
Thematic mapping can be made for whole system or for one part of the system.
 Steps to create or modify a thematic
mapping definition:
1) From the context menu with right mouse button select New or Edit
2) Set the name, value ranges and other desired options
3) In upper right part of the dialogue select the data from list or the data picker to choose desired values
4) Modify the mapped colors or ranges for the data which should be used for mapping
5) Define a legend according to required parameters to explain the mapping data
6) Define thematic mapping definition or changes with button OK